What, how and where: an assessment of multi-level European climate mitigation policies

Introduction
In February 2024, the European Commission presented its assessment of a 2040 climate target for the European Union, which calls for a 90% reduction in the EU’s net greenhouse gas (GHG) emissions compared to 1990 levels1. Central to this initiative is the overarching goal of achieving climate neutrality, a key pillar of the European Green Deal (EGD) launched in 20192. Realising this goal will necessitate consistent emission reductions across all sectors of the economy, requiring both the introduction of new policies and the strengthening of existing ones at both EU and Member State (MS) level3,4,5. While the EU provides strategic direction through initiatives such as the EGD, the success of these efforts ultimately depends on the collective action and commitment of all MS.
Addressing the challenge of mitigating GHG emissions and transitioning to a sustainable economy requires a range of different policy instruments, each capable of overcoming specific barriers, pursuing distinct objectives, and addressing various market failures6,7. Recent literature has focused on the study of the policy mix, understood as the simultaneous use of different policy instruments for climate change mitigation, analysing how it evolves and how the different instruments interact8. In the European Union, this complexity is accentuated by its multi-level governance structure, where the “horizontal” complexity of the policy package, characterised by different policies and objectives, is combined with the “vertical” complexity arising from the interaction between European and national-level policies9,10.
The EU represents a unique multi-level governance framework, comprising diverse actors, institutions, and interests11, and providing opportunities for policy innovation12, and international leadership13. The structure of EU governance has facilitated the introduction of various policies and instruments across different levels, enhancing the overall efficacy and feasibility of climate action10,14. However, this structure also carries risks of policy incoherence due to potential overlaps and conflicts between policies implemented at different levels of governance12,15. Such inconsistencies can undermine climate efforts if EU and national policies are poorly coordinated or if MS views EU policies as substitutes rather than complements to their national initiatives9.
While existing studies have examined the evolution of the European Union’s policy package5,7,10 and national climate policies16, they often treat these levels of governance separately17 or rely on qualitative assessments9. Given the increasing complexity and accumulation of policies over time, there is a need for improved empirical analysis on policy packages, integration, and coordination18. This paper aims to provide a comprehensive quantitative assessment of climate policy packages at both EU and MS levels. It analyses the evolution of these policy packages over time and explores the interactions between EU and national policies to determine whether they overlap, complement, or diverge from each other. In addition, the study analyses the different strategies adopted by MS and compares them with the broader EU policy direction, highlighting differences in sectoral priorities, policy instruments, and alignment with overall EU climate objectives.
In order to conduct an in-depth assessment of policies at both levels and capture key aspects of their evolution, this paper adopts a quantitative methodology that focuses on three dimensions: what has been done so far, i.e., how many policies are in place; how, i.e., which policy instruments are used; and where, i.e., in which sectors policies are applied. Rather than relying on traditional aggregate indexes that emphasise overall policy stringency, this approach facilitates a detailed analysis of the policy mix, understanding its sectoral scope, the diversity of instruments, and the consistency of implementation across levels of governance.
The first dimension concerns policy density by counting the number of policies in place at the EU level and within each MS, focusing in particular on the introduction and dismantling of policies19. The second dimension introduces a new sectoral coverage index that quantifies the share of emissions addressed by at least one policy. Finally, the third dimension assesses the composition of the policy mix through the Policy Mix Thickness Index (PMTI), which reflects the complexity of the mix considering the variety of instruments used and their respective types. The three resulting indicators are then analysed together with the Environmental Policy Stringency (EPS) index20, a commonly used stringency measure, to provide a comprehensive description of the strategies adopted by MS.
The analysis reveals differences between European and national approaches, with national policies often concentrating on specific sectors, and European policies exhibiting a broader scope and longer-term implementation aspects. The EU demonstrates a tendency to introduce policies in areas where the MS has been lacking, consistent with its role in providing overall policy guidance and setting collective targets. Despite differences in policy focus and instrument mix, the analysis suggests a logic of complementarity is followed between policies formulated at the European and national levels. Furthermore, the results highlight that a greater sectoral coverage or a higher number of instruments used by MS do not always correspond to a greater stringency of the overall policies package.
Results
Policy density
The first aspect of each country’s policy package analysed is policy density, namely the number of policies introduced in each country during the period under consideration. Figure 1 shows the total number of policies registered in the database for each MS. The five G20 countries have the highest number of policies recorded in the database, probably due to the greater coverage of the database for these countries. In particular, Germany records 237 policies, France 228, the United Kingdom 198, Spain 151 and Italy 133.

The bars represent the total number of policies registered in the dataset for each Member State country, namely the newly introduced policies between 1990 and 2023.
The first row of Table 1 presents the summary statistics of policy density for each country, covering the entire 34-year period of our analysis. This metric is derived from the cumulative introduction of policies (and hence their “flow”). All countries in the dataset have introduced at least two policies over the period considered, with Cyprus, Malta, and Croatia recording the lowest number of policy introductions. However, the distribution is mainly skewed towards countries that introduced a limited number of policies during these 34 years. Indeed, both the mean and the median are relatively low. Looking at the second row, it can be seen that a significant number of countries did not introduce any measures in some of the years under consideration: both the first quantile and the median result are 0, while the mean is only slightly above 1. In the Supplementary Materials are reported the summary statistics of the main indicator used in this study for each country.
Shifting our focus to EU community policies, the maximum number of policies introduced by Europe corresponds to 15 in 2001, probably under the influence of the start of the Lisbon Strategy (2000–2010). However, between 1990 and 2007, EU policies developed largely in isolation10, based on different objectives such as climate change, energy security, and economic growth. It was in 2007 that the EU began to set clear emissions targets, with the 2020 target (20% cut in GHGs from 1990 levels, 20% of EU energy from renewable sources, and 20% improvement in energy efficiency) leading to the adoption of the climate and energy packages in 2008.
Of the policies registered in the database, 1130 are currently in force, while 357 have ended, and 97 have been superseded. As detailed in the Method Section, the database has been extended to include the end dates of these policies, making it possible to calculate the total number of active policies each year. Figure 2 shows the annual counts of initiated and terminated policies for all MS and for the EU.

The total number of policies introduced and dismantled every year is represented both for all Member States (sum) and for European Union community policies.
Within the context of the MS, a notable peak in the introduction of new policies can be observed in 2009. Several hypotheses on contributing factors can be advanced. First, this surge coincides with a substantial wave of new policies implemented by Germany, with the highest number of policies introduced in a single year in a single country in our dataset. This rise can be attributed to a range of factors, including the culmination of Chancellor Merkel’s second term and the influence of the Integrated Energy and Climate Programme (IEKP) adopted in 200721. Additionally, the year 2009 was characterised by the COP15 international conference in Copenhagen, which brought climate change to the global forefront and is likely to have stimulated national action in several countries. In late 2008, the EU implemented a policy package with two main instruments: a revised version of the EU Emissions Trading Scheme, first introduced in 2003, and an effort-sharing decision based on binding national targets. Therefore, it could be presumed that the extension of domestic policies in 2009 also resulted from the policies enforced at the European level. In contrast, it can be seen that a large number of policies were dismantled in 2021, probably as a consequence of the fact that many introduced policies had 2020 as their target year and are, therefore, no longer active since 2021. In the following years, however, the number of policies introduced was not high enough for the total stock of active policies to increase further.
Overall, the number of policies dismantled is significantly lower than the number of policies introduced, suggesting that climate policies tend to be established with long-term goals, without predetermined expiration dates. This trend is even more pronounced at the EU level, where policies are likely to be primarily designed to implement long-term strategies and plans rather than rigid regulatory frameworks with predetermined expiration dates. Furthermore, it is worth noting that the EU level shows a more irregular pattern in the introduction of new policies, characterised by clusters of years with a particularly high number of new policies, such as the periods 1999–2001, 2005–2009, and the most recent years in the dataset (2018–2020). These clusters appear to be in the years around the adoption of significant climate strategies developed by the European Commission, such as the Lisbon Strategy (adopted in 2000), the 2020 target (adopted in 2007), and the EGD (announced in 2019). Additionally, an increase in new policies can be observed in 2014, the year before the Paris Agreement, when EU leaders adopted a climate and energy policy framework for 203010. However, the increase in EU policies does not consistently coincide with a corresponding increase in MS policies, either in the same years or in the years immediately following.
Sectoral coverage
To analyse the sectoral aspect of climate change policies, observations were categorised into six sectors as defined in the dataset. Policies may be associated with multiple sectors, and in these cases each policy was counted individually in the analysis, allowing for the possibility of multiple counts reflecting its presence in multiple sectors. This method guarantees that every sectoral dimension is examined in isolation.
Table 2 shows a comprehensive analysis of policy counts within each sector, including all policies recorded for both the EU and the sum of all the MS policies over the whole study period. The data reveals that the electricity and heat sector had the highest number of policies among the MS. In contrast, at EU level, the transport sector received the most policies in the years under review. At both the MS and EU levels, the agriculture and forestry sectors have received fewer policies despite their relatively greater significance at the EU level. There appears to be a focus on sector-wide policies within the EU (the “general” sector), probably due to the tendency of the EU to introduce strategic planning and more comprehensive policies.
Figure 3 presents a temporal overview of the introduction of policies in the MS and the EU in different sectors, taking into account the different percentage weights of sectoral policies compared to newly introduced policies. The Supplementary Materials reported expanded results on the sectoral introduction of policies. The increase in policy introductions since 1994 has been mainly in specific sectors, with the electricity and heat sector taking the lead in the MS from the beginning. Only around 2000 the transport and buildings sectors started to see an increase in policy introductions. Meanwhile, there was a peak in both the electricity and heat and buildings sectors between 2007 and 2010, followed by a decline in the introduction of new policies. It is worth noting that the peak in overall policy introductions that occurred in 2009 did not align with a peak in the electricity and heat sector, which had sustained high policy activity in the following year. Instead, it corresponds to a significant spike in the building sector. The agriculture and forestry sectors, as well as the industry sector, played a secondary role in the implementation of new policies, with only a slight increase in relevance observed in the later years of the study period.

The stacked bars represent the percentage of newly introduced policies belonging to each sector, in Member States (left panel) and European Union (right panel).
A more balanced sectoral introduction of policies can be seen at EU level, especially in the first decade of the analysis and in recent years. The transport sector has received increasing attention since the 2000s and the agriculture sector has also played a more important role in recent years. This contrasts with the MS, where neither of these sectors has been as prominent over the same periods, suggesting a complementary focus between MS and EU sectoral policies. However, the agriculture and forestry sector is often characterised by a relatively low level of policy implementation. Furthermore, at the EU level, it is possible to notice the adoption of more “general” policies, not referring to any particular sector.
Despite the limited implementation of policies in the agriculture and industry sectors across MS, many countries show full coverage of emissions when linked to sectoral policies. This finding is reflected in the coverage index introduced in the Method Section, which assesses the presence of policies relative to each sector’s share of emissions. A higher value of the index indicates more comprehensive policy coverage of sectoral emissions, with a value of 1 indicating full coverage, thus providing valuable insights into the effectiveness of sectoral policies in mitigating emissions. Figure 4 illustrates the evolution of the coverage index in the different MS over the reference period. Some interesting aspects can be noted. Firstly, both Germany and Sweden introduced policies in all sectors since 1995. Second, while there was a general increase in the coverage index until 2010, several countries have seen a decline in recent years, while countries with coverage gaps in earlier periods have generally maintained them. Lastly, there is a notable difference between Eastern and Western countries, possibly due to differences in EU membership and data coverage, but this gap has narrowed in recent years. It is important to note that while the index is calculated for the five macro-sectors available in the dataset classification, further analysis could potentially decompose the index into sub-sectors for a more detailed assessment.
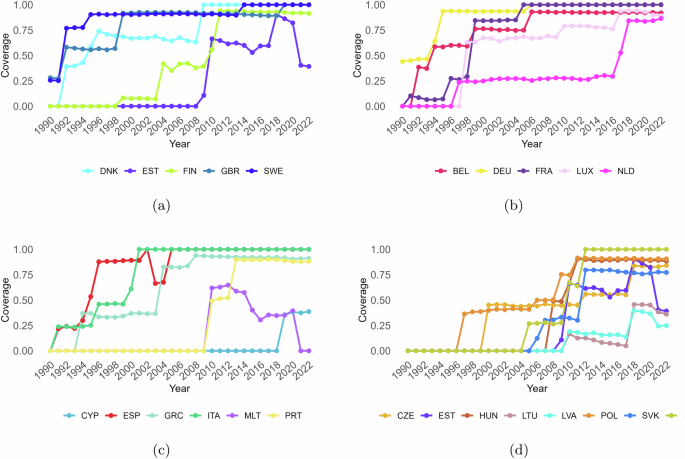
Trend over time of the Coverage Index of sectoral emissions in Member State countries: a represents Northern Europe countries, b Western Europe countries, c Southern Europe countries, and d Eastern Europe countries.
In a broader context, when examining the relationship between the number of active policies in each sector and the share of emissions attributed to that sector out of the total emissions of a country each year, a positive and statistically significant Pearson correlation coefficient is observed (p value 0.002). However, the magnitude of this correlation is really small (0.0457).
Policy mix and policy thickness
Considering the instrument dimension of the policy packages, it is useful to examine some characteristics of policy mixes by classifying them into different instruments, as shown in Table 3. Economic instruments are predominant within MS, encompassing diverse subcategories such as direct investment, fiscal or financial incentives, and market-based instruments. At the EU level, however, policy support emerges as the predominant instrument, in line with the EU’s role in providing policy support and guidance. Both MS and the EU have introduced relatively few climate change strategies. The employment of Research and Development and Deployment (RD&D) tools is more common at the European level than at the national level, while barrier removals are completely absent from the EU framework. Both MS and the EU rely significantly on regulatory and target-based instruments, which constitute a substantial part of their policies. Based on this preliminary analysis, it is evident that there are different preferences in terms of instruments between MS and the EU and that the different policy mixes are characterised by a high degree of complexity.
The complexity of the framework becomes even more pronounced when considering the different sectors and the wide range of policy instruments used, as illustrated in Fig. 5. It is evident that different policy instruments are introduced in different sectors. Firstly, regulatory instruments are extensively applied in all sectors, both at EU and MS levels, with a relatively higher percentage in the EU context. There has been a noticeable rise in policy support instruments in the agriculture and forestry sectors in recent years, but they have been introduced less frequently in the electricity and transport sectors. These instruments tend to be introduced in the early stages of policy implementation when few policies are in place and are often accompanied by information and education measures. In the electricity and transport sectors during the early 2000s, the peak of policy introduction was characterised by a predominance of policy support and RD&D instruments at EU level, while MS shifted more towards economic and regulatory instruments. Despite the subsequent decline in the number of policies introduced, the use of economic instruments at the national level remained high.
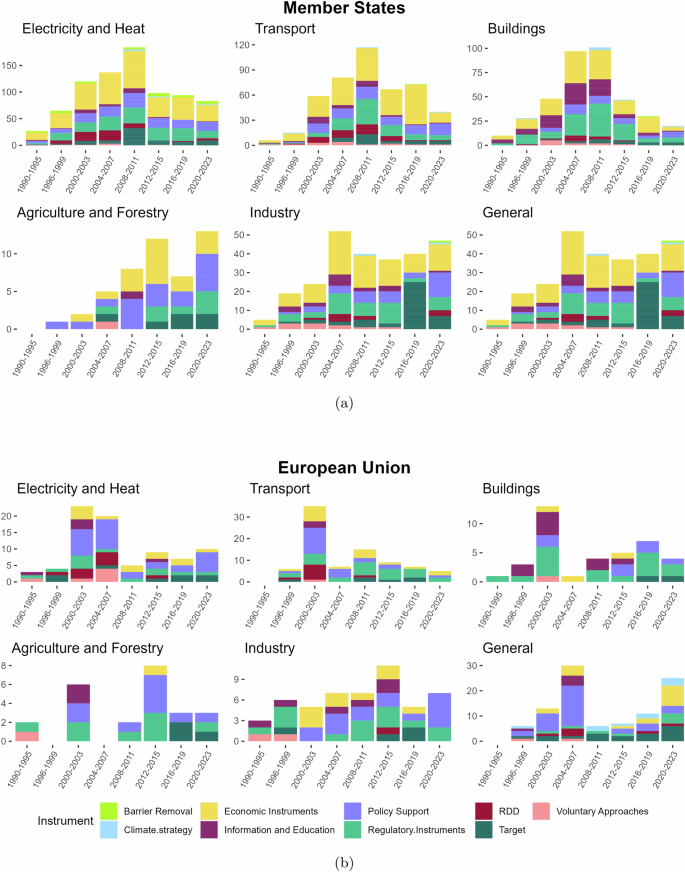
The sectoral policy mixes are represented considering their instrument decomposition over time. a On the top represents the Member States sectoral policy mixes; b on the bottom the European Union sectoral policy mixes.
The buildings sector is characterized by relatively higher use of information and education initiatives at the EU level, while MS is more inclined towards economic and regulatory instruments. In contrast, policies implemented in the agriculture and forestry sectors exhibit a distinct trend. Despite the low number of policies introduced in this sector, there has been a recent increase in the use of policy support instruments, especially at EU level, linked to the introduction of new targets. This indicates a recent increase in strategies, possibly signalling a shift in priorities over the last 10 years. Finally, the industry sector continues to have a significant presence of policy support and regulatory instruments at European level. Although economic instruments have been introduced significantly in recent years, they represent a relatively small part of the overall policy mix, which is dominated by regulatory instruments and targets.
Looking at the evolution of new policy introductions in different sectors, it is clear that there has been an increase in complexity, leading to thicker policy packages. To support this conclusion, a new descriptive index is proposed. As explained in detail in the Methods section, this study introduces the PMTI, an indicator to consider the degree of complexity of the policy mix in terms of the diversity of instruments used. The index is constructed as explained in the Method Section. In particular, taking into account the instrument classification of the dataset, I consider the presence of 52 possible policy instruments and 9 different types of policy instruments (the instrument categories, defining the diversity factor for the calculation of the PMTI). In the Supplementary Materials, it is possible to find the complete classification of instruments according to the dataset used. The PMTI is then calculated as detailed in Equation, relating the number of instruments and categories in each policy mix to the maximum possible number of instruments and categories. The index is bounded between 0 and 1, where 1 would represent the thickest (or most complex) possible policy package, including all 52 possible policy instruments.
As shown in Fig. 6, in the first years of the analysis, policy packages were characterised by less variability in the instruments used. Since the 2000s, the PMTI has started to increase, especially in some countries such as Sweden, Germany, and France. Since 2010, the PMTI has been measured as rather high in several MS, which means that in several countries, especially the larger ones, policy packages have become more complex, including an increasing number of different types of policy instruments. The analysis of this dimension shows a difference in the evolution of the index between Eastern and Western Europe, as was observed for the emissions coverage index. In general, many countries exhibit a persistent low PMTI, indicating a preference for specific types of policy instruments over diversifying their policy mixes.

Trend over time of the Policy Mix Thickness Index in Member State countries and in the European Union community (blue dashed line): a represents Northern European countries, b Western Europe countries, c Southern Europe countries, and d Eastern Europe countries.
Comparing different dimensions
To better understand the evolution of MS policy packages across the three dimensions considered in this analysis, Fig. 7 shows scatter plots related to the three main indexes developed. The first graph correlates the stock of active policies with the sectoral coverage index. The data indicate that when sectoral coverage remains low, there is typically a low number of active policies. Conversely, high levels of sectoral coverage are observed in countries with both a high and moderate number of policies. This suggests that achieving extensive sectoral distribution of policies does not necessarily require a large number of policies. Instead, it highlights that even with a moderate number of policies, countries can achieve broad sectoral coverage, indicating a strategic allocation of policy efforts across different sectors. The second graph illustrates the relationship between the number of active policies and the PMTI. Here it is possible to observe a more regular and less dispersed relationship, in which the observations follow an increasing and concave trajectory. Generally, it can be inferred that as the number of active policies increases, the complexity of the policy mix tends to intensify. The third graph examines the relationship between the PMTI and sectoral coverage. Similar to the first graph, we observe that low levels of sectoral coverage are typically associated with low PMTI levels, with some notable exceptions such as the Netherlands or Sweden. Conversely, when sectoral coverage is high, there is greater variability in PMTI levels, reflecting diverse strategies adopted by countries.

Scatter plots relating the different indices used in the assessment analysis. The left panel shows the relationship between the total number of active policies (stock) and the coverage index of emissions. The central panel shows the relationship between the stock of policies and the Policy Mix Thickness Indicator. The right panel plots the relationship between the PMTI and the Coverage Index.
A similar analysis is conducted with respect to the EPS. As illustrated in Fig. 8, the relationships between this index and the measure proposed here do not appear particularly strong. Interestingly, in the first scatter plot, which relates the number of active policies with the EPS, we observe a cluster of countries where, despite applying fewer policies, they are ranked as having a relatively stringent policy package, such as Sweden, Denmark, and Finland. Conversely, in the cases of France, Germany, and the UK, we notice an increase in EPS with an increase in the total number of active policies.

Scatter plots relating the different indices used in the assessment analysis with the EPS. The left panel shows the relationship between the EPS and the total number of active policies (stock). The central panel shows the relationship between the EPS and the Coverage Index. The right panel plots the relationship between the EPS and the PMTI.
The EPS does not consider, by construction, how policies are distributed across sectors. The second plot examines the relationship between EPS and sectoral coverage. While countries with low coverage generally exhibit low EPS, some countries with a coverage level of 0.25 already demonstrate high policy stringency, as seen in the case of the Netherlands. Finally, examining the relationship between EPS and PMTI reveals that while low levels of policy stringency correspond to low levels of policy thickness, higher levels of stringency are distributed across various thickness levels. This observation may be attributed to the construction of the EPS index, which aggregates different instrument categories with equal weight. Consequently, the EPS—similar to other policy stringency indexes–may obscure characteristics of policy packages. Adopting a more comprehensive approach, such as the indexes proposed here, can offer a deeper understanding of the characteristics and evolution of policy packages.
Discussion
The assessment of mitigation policies conducted in this study provides a comprehensive understanding of the characteristics and evolution of policy packages at both EU and MS levels. By examining policy packages through three distinct dimensions—policy density, sectoral focus, and instrument composition—we can analyse different aspects of the climate action strategies at both the European and national levels. From these insights, it is possible to derive some general conclusions about how the two levels of governance interact and influence each other.
Over the last three decades, the scope and complexity of climate change policies in the EU and its MS have increased significantly. The start of climate change policies in Europe coincided with the implementation of the Kyoto Protocol15. Since then, the EU and its MS experienced a consistent rise in the number of active policies, although this growth appears to have decelerated in recent years. When comparing the introduction of policies at the two governance levels, no clear pattern emerges: increases in EU-level policies do not necessarily lead to corresponding increases in MS policies, nor do they correlate with decreases at the national level. Furthermore, European policies exhibit a lower dismantling rate compared to national policies, aligned with more long-term objectives. This first result shows the presence of a degree of independence in the legislative process related to climate policies between MS and the EU: not all policies introduced at the MS level are a consequence of EU policies, and no clear pattern emerges in this regard. In general, since the 1990s, the EU has developed a climate policy package increasingly distinct from national policies, and MS still retains a degree of independence in focusing their climate action15. The data also reveal a differentiation in the sectoral focus between MS and EU policies. The MS tends to implement more sector-specific policies, particularly targeting the electricity and heat sector. In contrast, EU policies often have broader objectives, encompassing general goals rather than specific sectors. Additionally, the EU introduces sectoral policies with a more balanced focus across various sectors, frequently addressing areas where MS policies are lacking, such as in agriculture and forestry.
Considering the instrument composition applied in the policy packages, distinct preferences emerge between the MS and EU levels. While the MS tends to favour economic and regulatory instruments, the EU demonstrates a preference for policy support instruments as well, especially in the last years. Historically, MS tended to have more elaborate policy mixes22, but the EU in recent years has also differentiated the policy mix used7 moving away from the mere use of regulatory instruments14. An interesting trend from the data analysis is the EU’s inclination to implement specific instruments in sectors with fewer existing policies, such as policy support, education and information, RD&D, and voluntary approaches. These instruments might be introduced to pave the way for subsequent, more stringent policies16,23. To further explore this dynamic, future research could examine the evolution of policy sequencing, both within the same governance level (EU or MS) and in a multi-level context. Specifically, this analysis could investigate whether the introduction of certain instruments at the EU level facilitates the adoption of more stringent instruments at the national level.
Overall, the different lengths of policies, sectoral focuses, and instrument compositions of the policy mixes reflect the complementary roles of the EU and MS within the governance framework. MS primarily develop policies to directly control national emissions, while the EU focuses on providing overall policy guidance, setting collective targets, and encouraging policy adoption5. The EU and national policies complement and reinforce each other by employing different policy instruments and targeting different sectors24.
Considering the different indexes analysed in a cross-country comparison, different climate action strategies emerge. First, some countries have focused on adopting sectoral policies across multiple sectors from the early years of the analysis, resulting in a high coverage index. Conversely, some countries with a lower coverage index still achieve a high level of policy stringency overall. Second, considering the thickness of the policy mixes, some countries rapidly increase the complexity of their policy packages, while others maintain simpler packages or stabilise their complexity over time. Interestingly, lower levels of coverage or PMTI do not always correspond to lower levels of policy stringency. Third, a noticeable gap exists between Eastern and Western countries. Generally, Eastern countries have a lower coverage index, a less complex policy mix, fewer policies, and lower stringency, consistent with the greater scepticism toward climate policies often expressed by these countries15,25. In summary, the cross-country analysis of different dimensions and indexes reveals that various strategies have been adopted, highlighting the importance of considering these distinct characteristics in evaluating policy packages.
Finally, the results of the analysis can help identify significant policy gaps across European countries in the context of the EU’s 2040 climate goals. According to the EU Commission’s recommendations, the energy supply sector is expected to achieve the greatest emissions reductions by 20401. This aligns with the current focus of MS on policies in the electricity and heat sectors. However, other sectors must also significantly reduce their emissions to meet these targets. For instance, both the industry and agriculture sectors are expected to achieve emissions reductions of not less than 70% compared to 2020 levels. As the previous analysis highlighted, these sectors currently have a low density of policies at the MS level. Although the EU has intensified its climate action in these sectors in recent years, this may not be sufficient to meet the 2040 goals, especially considering the types of policy instruments predominantly introduced by the EU. Furthermore, these sectors face possible challenges and political obstacles. For example, recent protests by European farmers and concerns over job losses in the industrial sector illustrate the political feasibility issues surrounding policy implementation. The actions of the upcoming EU Commission and Parliament will be crucial in making the 2040 goals attainable.
Several limitations of this study should be noted, along with the potential for future expansion. First, this study adopted the concept of “policy thickness”7 and operationalised it by constructing a new index, the Policy Mix Thickness Index (PMTI). While the PMTI is useful for discussing the complexity of the policy mixes adopted by countries, it is worth noting that the presence of multiple instruments can have both positive and negative aspects, potentially increasing feedback effects among instruments26. Attention to the possibility of feedback in policy formulation is then essential to ensure a positive outcome8,27. Consequently, a more in-depth examination of the composition of policy mixes and how their components interact would be essential, for example by looking at specific case studies28. In addition, the approach behind the PMTI does not take into account the potential interdependencies between policy instruments. In particular, it may be necessary to introduce some instruments after others have been implemented. In this sense, the increase in policy thickness could be partly explained by a natural increase of complexity through the normal evolution of the policy mix with interdependencies between different instruments. Second, the database used for this analysis classifies only five sectors, resulting in broad sectoral definitions. When looking at sub-sectors within the database, these classifications do not correspond to the sectoral classifications commonly used in emissions databases. This limitation affects the level of detail of the proposed coverage index calculation, which could be more informative with a finer sectoral classification. In addition, the sectors considered do not match those in other databases (e.g., World Bank, or OECD), not allowing the introduction of additional control variables (e.g., sectoral GDP). Additionally, at the national level, the database includes all policies without distinguishing whether they originate from European directives or are independently developed by MS. Similarly, while EU policies are included, they are not categorised based on their typology or origin, such as legislative acts, directives, regulations, or other forms of policy instruments. This lack of distinction limits the accuracy of the analysis in capturing the nuances of multi-level policy dynamics within the European Union. Finally, this study maintains a broad focus, primarily comparing the EU with the MS from a quantitative perspective to summarise the main features of the policy packages. A comparative analysis among a smaller set of countries, complemented by more in-depth qualitative methods, could provide further insights on the implementation of multi-level policies, the coherence of policy packages, and whether the evolution is in line with the goal of multi-level strengthening also in relation to the international arena13.
However, synthesising the characteristics of policy packages through indexes provides a valuable tool for comparing and evaluating climate policies19. This method is particularly important when addressing the challenge of climate change within the complex governance structure of the European Union. The use of well-defined criteria and indexes provides an opportunity to systematically compare and evaluate policy packages. This approach not only offers a comprehensive overview of climate governance but also highlights crucial aspects that might otherwise remain obscured. In general, the use of indexes facilitates transparency and accountability, allowing policymakers, researchers, and the public to monitor progress, identify areas for improvement, and assess the effectiveness of climate policies.
Methods
Evaluating the effectiveness of climate policy packages is a key challenge, particularly in the context of deriving actionable insights and learning from experience. Several complementary approaches can be taken in this regard, such as evaluating the effectiveness of individual policies29,30 or constructing stringency or aggregate indexes that describe the overall ambition of policy packages20,31,32. However, given the complexity of policy packages and the possible interactions between the different policies introduced, this approach needs to be complemented by an assessment of the policy packages as a whole. Considering the use of aggregate indexes may obscure characteristics that are crucial for an in-depth understanding of policy packages. Factors such as the sectoral application of policies, the types of instruments used, and the overall consistency of policy implementation require more detailed examination33,34.
In recent years, the development of databases specifically dedicated to the collection and classification of climate policies has facilitated the use of a third, complementary approach that directly describes countries’ policy mixes. This places greater emphasis on a more nuanced understanding of policy packages, taking into account factors such as sectoral application, types of policy instruments, and coherence, and allows for the development of more detailed comparative studies on the evolution of different policy packages35.
This study looks at the EU and its MS with the aim of providing a historical perspective on the last three decades of climate policy and drawing lessons for future policy implementation. While the foundations of the EGD can be traced back to policies implemented since the early 1990s10, examining these 34 years of climate policy can provide valuable insights into the EU’s multi-level policy framework, its composition and focus, and how climate action differs between MS and the EU.
In particular, the analysis is based on the Climate Policy Dataset (CPD) developed by the New Climate Institute, which collects and classifies all climate change policies from 1990 to 2020. In this sense, I adopt a broad definition of climate policies, defined in the dataset as “a law, strategic document, a target, or any other policy document that results in lasting reduction on the country’s emissions intensity”36 and in line with previous studies35,37 among others. Furthermore, my analysis is based on a policy density perspective, reflecting the idea of providing a descriptive assessment of the policy packages in the EU and its MS, rather than an evaluation of them.
The following sections describe in detail all the dimensions considered and the corresponding indicators chosen. While the analysis of each dimension separately provides important descriptive insights into the characteristics of the policy packages, the combination of the different indexes allows for a comprehensive understanding of how policy packages have changed over time and where they diverge. Following the discussion of each dimension, the analysis then examines the relationship between the main indexes proposed. In addition, they are compared with a commonly used index of policy stringency, the EPS developed by the OECD. The EPS is calculated for climate change and air pollution policies and does not include policies from other environmental domains38. It is, therefore, appropriate to make a comparison with the indexes proposed in this study for the climate change policy packages.
Policy density
Policy density captures the level of policy activity, quantified by the number of policies or instruments introduced or in force in a country over a given period. The use of this indicator has recently gained prominence in the literature19,39,40. By focusing on output data (the number of policies) rather than impact data (such as emissions), this approach conceives policy density as a measure of policy ambition, even if the stringency of these policies is not taken into account. Although, in this case, the number of active policies per se is considered to reflect a government’s willingness to address climate change40, recent studies have shown that there is a relationship between the measure of policy density and GHG emission reductions41,42.
The use of policy outcome data makes it possible to determine the direction of policy change, whether there is an increase or decrease in the number of policies introduced or active, in the use of different instruments, and/or in the scope of policy19. This approach allows for a comprehensive assessment of policy packages as a whole, rather than assessing each policy measure in isolation.
The first dimension analysed in this assessment is, therefore, based on measures of density, i.e., the number of policies adopted by a country in a given year. However, looking only at the number of new policies adopted has some limitations. Indeed, a common problem when using the policy density approach is the frequent lack of data on policy end dates. This limitation hinders the assessment of policy duration and complicates the disaggregation of policies, thus limiting the policy density analysis to newly introduced policies40. To overcome this problem, I have extended the original database by allowing two separate measures of policy density to be considered: the “flow” of policies, which indicates how many policies have been introduced in a given period, and the “stock” of policies, which represents the number of active policies in the same period.
Moreover, by focusing only on the number of policies, this measure does not take into account the sectors in which policies are applied, nor the type of policy instruments that are part of policy packages. Therefore, besides disaggregating policy density by sector and instrument, this assessment proposes two new indexes to better assess the sectoral dimension and the mix of active policies at different European levels. The following sections explain the specifics of these indexes and how they provide valuable insights into the effectiveness of climate policy outcomes.
Sectoral coverage
The second aspect of countries’ policy packages analysed is their sectoral dimension. Considering the sectoral dimension of policy application provides insights into the historical focus of each country’s policy package and allows for the assessment of sectors that may have been overlooked. Ideally, policies should span across all sectors of the economy to effectively address relevant emission sources and ensure the implementation of key mitigation strategies. Indeed, sectoral climate policies have the potential to overcome specific barriers to mitigation and lead to significant emission reductions43.
To assess the sectoral focus of climate policies and their application across emission sources from different sectors, I first disaggregate the density of policies by sector. Furthermore, I consider the coverage of emissions, namely whether each sector is involved in at least one specific policy. Previous analysis35 examined the sectoral coverage of climate change policies in the G20 countries, but considering sectors in absolute terms. In contrast, this study aims to evaluate the relative importance of sectors targeted by policies.
To determine whether the implementation of national and EU policies is targeted at the sectors responsible for a significant share of emissions, the policy dataset is linked to a comprehensive emissions dataset (see the Method Section for details), and an emissions coverage index is proposed and calculated. The index is defined as follows
where si,t.k is defined by:
where i denotes the country, k the sector, and t the year. The ratio of covered emissions is determined by comparing emissions from a specific sector in a given year, ei,t.k, to total emissions of the country in the same year, ei,t. The multiplier I is a dummy variable; it takes the value 0 if there are no active policies in the specified sector and country for that year, and the value 1 if at least one policy is implemented. The resulting index ranges between 0 and 1. A value of 0 indicates that there are no policies targeting emissions in any sector, while a value of 1 indicates full coverage, i.e., that all emissions are addressed by at least one specific policy. Values between 0 and 1 indicate the proportion of emissions covered by policies, while the difference between 1 and the index value represents emissions not directly targeted by any policy. This index is inspired by the concept of emission-weighted carbon pricing44, where carbon prices are weighted according to the relative emissions of different sectors. In this study, the coverage index serves a broader purpose by quantifying the extent to which emissions are controlled by at least one policy.
Policy mix and policy thickness
Although the economic literature tends to recognise a theoretical preference for the use of market-based instruments to incentivise transition45, in reality it is possible to observe a wide use of different instruments applied simultaneously in the same area. Therefore, evaluating policy packages as a whole allows not only to assess the policy performance of countries, but also to examine the mix of policy instruments used. Despite the risk of contradictions and overlaps, the use of a mix of instruments is usually justified by the need to tackle a complex problem such as climate change from different perspectives27,46. Different instruments, even if implemented in the same area, may therefore be necessary to address different market failures or to try to achieve multiple objectives6, and several studies find that broader policy packages are more successful for a sustainable transition47,48.
A possible criterion for assessing the diversity of the mix of policy instruments needed to address the multiple barriers and drivers of transformation is the “policy thickness” defined as the number and diversity of different policy instruments that a policy mix includes7. The concept of policy thickness takes into account both the number and diversity of types and subtypes of policy instruments. In this respect, a mix of N + 1 different policy instruments can be defined as being thicker than a mix of N different policy instruments. However, in the presence of two mixes of N policy instruments, the one that contains a greater number of different policy types is considered thicker.
Adopting the definition and operationalisation of thickness, I introduce a new index called the Policy Mix Thickness Index (PMTI). The PMTI is expressed as follows
where Ni,t is the number of different policy instruments in the mix of country i in year t and Di,t is the diversity factor of the policy instrument types. The diversity factor Di,t is determined by quantifying the variety of policy instrument types within the mix7. The denominator of the PMTI equation is given by N, the total number of instruments in our classification, multiplied by the largest possible value of the diversity factor. Thus, by definition, the indicator is bounded between 0 and 1. The higher the PMTI, the thicker the policy mix, i.e. the more diverse and the more policy instruments are included in the country’s policy package.
Data
The primary database on which this analysis is based is the CPD, developed and maintained by the New Climate Institute with support from PBL Netherlands Environmental Assessment Agency and Wageningen University and Research. This database comprehensively collects and classifies climate policies (e.g., laws, decrees, executive orders, or their equivalents) with a specific focus on mitigation36 and is recognised as the most comprehensive database available on the subject40. Each policy is one entry in the database, for which different characteristics are coded, such as jurisdiction, instruments, sector, and mitigation area. From the database provided, a measure of the density of mitigation policies is calculated for the 28 MS of the European Union and for the EU as a whole from 1990 to 2023. Indeed, EU policies at the community level are classified in the database as if the EU were a single country.
This analysis uses the 2023 version of the CPD, which contains policies adopted as of the end of 2023. Policies implemented at the subnational level, such as regional policies (67 policies in the initial dataset), and at the city level (28), are excluded from the analysis; likewise, policies not related to mitigation (100) are also excluded. Of the remaining 1,606 policies, 1,395 are national policies implemented in the different MS, while 179 are EU policies implemented at the community level. As explained above, the database considers a broad definition of policies, which is also applied in the case of the EU. In this sense, all the different legislative acts of the EU Parliament and Commission are reported in the dataset as climate policies. Additionally, at the national level, the dataset includes all national policies without specifically differentiating whether they originate from European directives or are independently developed by MS.
The first measure of policy density I discuss is specifically the number of policies introduced in each country, which we call the “flow” of policies. Conversely, calculating the number of policies that are actually active in each country required further data processing. Of the 1606 policies in the dataset for European countries, 454 are classified as “Ended” or “Superseded”. However, only 192 of these had a recorded termination date, leaving 262 policies with missing values. In order to fill this data gap, a multi-step screening process was carried out. First, information on terminated policies was obtained from the Policies and Measures (PAMS)49 dataset developed by the International Energy Agency (IEA), which is one of the sources of the CPD dataset. Since some policies classified as “Ended” or “Superseded” in the CPD dataset appeared to be still in force according to the PAMS dataset, it was decided to classify them as still in force in these cases. Second, a manual search was conducted for relevant information on each policy with missing end dates. This manual search resulted in 72 policies with unresolved missing values. However, 22 of these missing values are from policies that are classified as “Superseded” in the dataset, but for which there is no new corresponding policy. They are then considered to be still in force in the analysis. Finally, for the remaining 50 policies with a missing end date, the average duration of policies in the dataset was adopted, which corresponds to 16 years. By completing the dataset with the relevant termination dates, it was possible to calculate the number of active policies in each country for each year, which represents the “stock” of policies.
Using the same dataset, it is also possible to decompose the policy density according to the two main characteristics of the policies analysed in this assessment: policy instruments and sectoral policy dimension. The database classifies policies according to different categories of instruments, grouped into 9 main categories derived from the IEA classification. Similarly, the database considers five main sectors: buildings, industry, transport, electricity and heat, agriculture and forestry, and a “general” sector that includes policies of general purpose. Both classifications are not unique: as many laws or policies introduced involve different instruments and measures, they could be classified in the dataset according to more than one policy instrument or in relation to more than one sector. More details on the taxonomy of the database can be found in the Supplementary Materials of this paper.
In order to consider the sectoral dimension more comprehensively and to construct the proposed coverage index, the policy dataset was linked to sectoral and national emissions derived from the Emissions Database for Global Atmospheric Research version 8 (EDGARv8). By aggregating some of the sectors reported in the EDGAR database, the sectoral emissions classification is consistent with the sectoral policies reported in the Climate Policy Database. In particular, the EDGAR dataset reported the following sectors: agriculture, buildings, fuel exploitation, industrial combustion, power industry, processes, transport, and waste50,51. To have a consistent match with the sectoral classification of the CPD36) the sectors fuel exploitation, industrial combustion, waste, and processes have been aggregated in the industry sector, while the power industry has been used under the electricity and heat sector.
Finally, the indexes proposed in this study are compared with a widely used indicator of policy stringency, the EPS index developed by the OECD. This index is constructed by considering three different policy categories: market, non-market, and technology support policies38. For each of these categories, a policy stringency index is calculated, and these are then aggregated with equal weights to derive the overall policy stringency of each country’s climate policy package. The index ranges from 0 to 6, with six representing the maximum level of policy stringency, and the data for this index are available from 1990 to 2020.


Responses