What large language models know and what people think they know
Main
Uncertainty communication plays a critical role in decision-making and policy development. Uncertainties are often expressed verbally to help stakeholders understand risks and make informed choices across a wide range of domains, including climate policy, law, medicine and intelligence forecasting. Psychology research has investigated perceptions of verbally expressed uncertainty (for example, phrases such as ‘very unlikely’ or ‘almost certain’) in these domains1,2,3,4,5. Despite their lack of precision in communicating probabilities, verbal probability phrases provide a simple and effective way to communicate uncertainty in natural language contexts. The emergence of large language models (LLMs) introduces new complexities in the area of uncertainty communication. These models are increasingly integrated into areas such as public health6, coding7 and education8. However, the question of how effectively LLMs communicate uncertainty is unexplored. As the primary mode of communication with LLMs is through natural language, it is critical to understand whether LLMs are able to accurately convey through verbal means what they know or do not know.
Recent research raises doubts about the reliability of the information that LLMs generate. One notable issue is the possibility of generating responses that, while convincing, may be inaccurate or nonsensical9,10. The unreliability of LLMs has led developers of LLMs to caution against the uncritical acceptance of model outputs11, suggesting that it is not always clear when the models are or are not confident in the knowledge communicated to the user.
At the same time, recent research has also indicated that LLMs have the ability, to a certain degree, to accurately discern their own knowledge boundaries. LLMs in particular can exhibit a reasonable level of calibration for multiple-choice questions such that the probability the model assigns to a selected answer tracks with the probability that this answer is correct12,13,14. In addition, recent studies show that LLMs can distinguish between answerable and unanswerable questions13,15 and the internal state of an LLM can distinguish between truthful statements and lies16 and truthful statements and confabulations17. These findings suggest that LLMs may possess an internal mechanism that is reflective of self-knowledge.
In the specific context of question-answering, an LLM’s model confidence is typically equated to the probability assigned by the LLM to the selected answer relative to other possible answers (for example, refs. 18,19). However, from the perspective of a human interacting with the LLM, this internal model confidence is not usually displayed to human users as part of LLM output. Instead, in current practice, humans rely solely on the language produced by the LLM to assess LLM confidence. To contrast with model confidence, in this article we use the term human confidence to refer to a human’s assessment (expressed as a probability) of how likely it is that the LLM’s answer is correct based only on the language produced by the LLM without any knowledge of the LLM’s internal model confidence.
Surprisingly, studies focused on investigating human confidence in LLM outputs are lacking. In this article, we take a step in addressing this issue and investigate what we term the calibration gap, namely the difference in the reliability of LLM model confidence and human confidence. In effect, the calibration gap represents the gap between an LLM’s own internal confidence of what it knows and human perception of this confidence. In addition, we investigate the discrimination gap, which relates to the difference in the ability to discriminate between probably correct and incorrect answers. Any discrimination gap shows that whatever internal LLM representation is used to tell the difference between probably correct and incorrect answers is not conveyed effectively to humans. We address two specific research questions in this context. First, how large are the calibration and discrimination gaps? That is, is there a notable gap between LLM model confidence and human confidence in terms of how each assesses the true accuracy of the LLM? Second, can the calibration and discrimination gaps be reduced? Can the quality of human confidence in an LLM be improved by adapting the textual output of the LLM to internal model confidence? These questions have important implications for the design of reliable LLM assistants. By aligning the LLM’s internal confidence with human perception of this confidence, we can bridge the gap between what LLMs know and what people think they know, which is crucial for the development of effective and trustworthy assistants
Our contributions in this context are twofold. First, we present a set of experimental studies and a dataset that directly captures human assessment of LLM confidence in a question-answering context, providing insight into human perceptions of LLM textual responses. Second, we test and suggest ways of generating LLM responses that improve the calibration quality of human confidence relative to the LLM assistant’s model confidence and the LLM’s true accuracy.
LLMs
We use three publicly available LLMs in our studies: GPT-3.5 (ref. 20), PaLM2 (ref. 21) and GPT-4o. We apply the GPT-3.5 and PaLM2 models to a subset of multiple-choice questions from the Massive Multitask Language Understanding (MMLU) dataset, a comprehensive dataset that contains multiple-choice questions from various knowledge domains, such as science, technology, engineering and mathematics (STEM), humanities, social sciences and more19. We apply the GPT-4o model to a subset of short-answer questions from the Trivia QA dataset22. For each multiple-choice and short-answer question, we assess the model confidence by computing the token likelihoods (see the Methods for details). This method for reading out model confidence allows a direct computation of the relative probabilities of different possible answers in multiple-choice questions12,13,18,19,23 and the probability that the answer to an open-ended question is correct13,17. We investigate the relationship between model confidence and accuracy to determine whether the LLM is reasonably well calibrated, independent of the LLM’s ability to elicit well-calibrated confidence from humans who use the LLM.
Behavioural experiments
We designed behavioural experiments to evaluate human perceptions of LLM confidence. In these experiments, participants estimate the probability that the LLM’s answer to a multiple-choice or short-answer question is correct based on the explanation that the LLM provided (Fig. 1). Participants are not provided any direct access to the LLM’s numerical model confidence, allowing us to make inferences about participants’ perceptions of the confidence of the LLM based on model explanations alone. In addition, for the multiple-choice questions part of the experiment only, with the assistance of the LLM, participants provided answers to the questions. Previous research has demonstrated that the MMLU multiple-choice questions are difficult for participants who lack domain expertise, resulting in near-chance accuracy19. We anticipate that these questions will be difficult to answer without the assistance of the LLM because the majority of the participants in our experiments lack domain expertise, and their perception of the explanation’s content will influence their evaluation more than their own knowledge.

The multiple-choice questions, the approach works as follows: (1) prompt the LLM with a question to obtain the model’s internal confidence for each answer choice; (2) select the most likely answer and prompt the model a second time to generate an explanation for the given answer; (3) obtain the human confidence by showing users the question and the LLM’s explanation and asking users to indicate the probability that the model is correct. In this toy example, the model confidence for the multiple-choice question is 0.46 for answer C, whereas the human confidence is 0.95. For short-answer questions, the approach is similar except that internal model confidence is obtained by an additional step where the LLM is prompted to evaluate whether the previously provided answer to the question is true or false13. In the short-answer question example, the LLM model explanation was modified with uncertainty language to convey the low model confidence (0.18). For the two toy examples, the correct answers are ‘A’ and ‘blue bird’.
We conducted two experiments each involving the three types of LLMs and two types of questions (see Table 1 for an overview). Experiment 1 assesses human perceptions of LLM accuracy using the LLM’s default explanations for either multiple-choice or short-answer questions. The results from this experiment allow us to address the first research question regarding the size of the calibration and discrimination gap between model and human confidence. Experiment 2 manipulates the prompts to produce three levels of uncertainty language (low, medium and high confidence) and three levels of explanation length, resulting in nine different types of explanations presented to participants. The prompts are designed to include uncertainty language corresponding to model confidence at the start of the explanation. Table 2 illustrates explanations from a particular multiple-choice question used in the experiments (see Supplementary Table 2 for the full model explanations). The results from this experiment serve two purposes. First, we establish that human confidence varies with the uncertainty language and the length of the explanation. Next, we use the results from experiment 2 to answer the second research question, which is to understand how the calibration and discrimination gap can be reduced by aligning the uncertainty language with model confidence—showing a low-, medium- and high-confidence explanation when the model has low, medium and high confidence, respectively. The Supplementary Information (‘experiment 3’) reports the results from an additional experiment with a different prompting approach that alters the default explanations from experiment 1. We use the two metrics to assess the relationship between human and model confidence and model accuracy. See Methods for details.
Results
We start by examining the results from experiment 1 and compare human and model confidence in the case where LLMs generate default explanations for participants. We present the results for two different metrics: (1) expected calibration error (ECE), which assesses the degree to which confidence scores from the model or the human reflect the true accuracy of the LLM, and (2) area under the curve (AUC), which assesses the degree to which confidence scores discriminate between correct and incorrect responses (see the Methods for details). The findings indicate that there is a significant gap, as measured by calibration and discrimination, between what LLMs know and what humans believe they know based on default explanations.
Calibration gap
Figure 2 (left) shows the ECE for both model and human confidence. The results show a calibration gap; across the different types of LLMs and types of questions (multiple choice and short answer), the ECE metric is much lower for model confidence (in grey) than for human confidence with baseline explanations (in green). This gap demonstrates that standard explanations provided by the LLM do not enable participants to judge the likelihood of correctness of the LLM’s answers, leading to a misalignment between perceived accuracy and actual LLM accuracy.

Calibration error is assessed by ECE (lower is better), while discrimination is assessed by AUC (higher is better). The vertical dashed lines represent the calibration and discrimination gap between model confidence and human confidence for unmodified explanations (experiments 1a, 1b and 1c). For human confidence, the data points represent the AUC values computed separately for each participant (n shown in figure) and the error bars represent the 95% confidence interval of the mean across participants. Because of data sparsity, the ECE values were computed at the group level.
Source data
Figure 3 expands on the calibration results in Fig. 2 to show detailed calibration results for each LLM and each experimental condition. The diagrams show how well model confidence (left column) and human confidence (right two columns) are calibrated. The ideal calibration (that is, ECE of 0) would yield results along the diagonal. For multiple-choice questions, both LLMs have a tendency to be overconfident, resulting in calibration lines below the diagonal. For the short-answer questions, the LLM is somewhat underconfident. Comparing the LLM with the human calibration in experiment 1 (middle column), the results show that, for the multiple-choice questions, human miscalibration is primarily due to overconfidence, indicating that people generally believe that LLMs are more accurate than they actually are. The histograms (inset panels) demonstrate that a substantial portion of the calibration error is due to participants’ propensity to produce high-confidence scores, even though the model accuracy for the associated questions is much lower than expected based on confidence.

The top and middle rows show results for multiple-choice questions with the GPT-3.5 and PaLM2 models, respectively. The bottom row shows results for short-answer questions with the GPT-4o model. The histograms at the bottom of each plot show the proportion of observations in each confidence bin (values are scaled by 30% for visual clarity). The shaded regions represent the 95% confidence interval of the mean computed across participants and questions.
Source data
Discrimination gap
Participants are not very good, relative to the LLM, at discriminating between which answers are probably correct or incorrect based on the default explanation. We assess discrimination using the AUC metric applied to the human confidence ratings. Figure 2 (right) shows the AUC for both model and human confidence. The results show a gap between how well model and human confidence discriminate between correct and incorrect answers. The LLM model confidence discriminates between correct and incorrect answers well above chance (GPT-3.5 AUC 0.751 and PaLM2 AUC 0.746 for the multiple-choice questions and GPT-4o AUC 0.781 for the short-answer questions). By contrast, participants who view the default explanations in experiment 1 were only slightly better than random guessing (AUC 0.589 and AUC 0.602 for the multiple-choice explanations by GPT-3.5 and PaLM2, respectively, and AUC 0.592 for the short-answer explanations by GPT-4o). Therefore, default explanations lead to a discrimination gap as well.
Explanation style and length affect human confidence
Experiment 2 evaluates how human confidence is affected by the degree of uncertainty expressed in LLM explanations (across three levels of confidence) as well as the overall length of the LLM explanation (across three levels of length).
Figure 4 shows that the type of uncertainty language used in the explanations has a strong influence on human confidence regardless of the type of LLM that produced the explanation or the type of question. Low-confidence explanations (‘I am not sure’) produced significantly lower human confidence than medium-confidence explanations (‘I am somewhat sure’); Bayes factor (BF) >100 across experiments 2a, 2b and 2c. Similarly, medium-confidence explanations produced lower human confidence than high-confidence explanations; BF >100 across experiments 2a, 2b and 2c. The Supplementary Information (‘human confidence agreement’) shows an analysis of the reliability of the confidence ratings across participants.
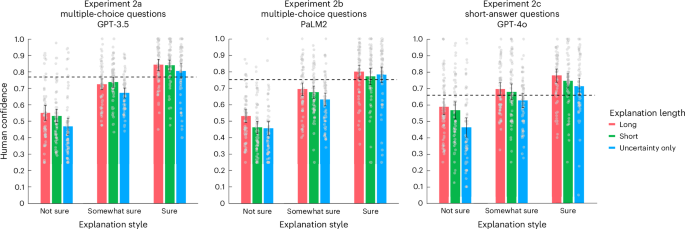
Data are presented as mean values of participant confidence in experiments 2a (n = 60), 2b (n = 60) and 2c (n = 59). For reference, the dashed lines show the average human confidence for the baseline explanations in experiments 1a, 1b, and 1c. The error bars represent the 95% confidence interval of the mean across participants.
Source data
In addition, the length of the explanations also affected the human confidence in the LLM answers. Long explanations led to significantly higher confidence than the short explanations (BF of 25 with data combined across experiments 2a, 2b and 2c), and short explanations led to significantly higher confidence than the responses that contained only the uncertainty expression (BF >100 with data combined across experiments 2a, 2b and 2c). The additional information presented in longer explanations did not enable participants to better discriminate between probably correct and incorrect answers for longer explanations. Across experiments 2a, 2b and 2c, the mean participant AUC is 0.54 and 0.57 for long and uncertainty-only explanations, respectively (BF of 0.23). Therefore, the length of the answer led to an increase in human confidence without any corresponding change in sensitivity to discriminating between correct and incorrect answers.
The results confirm that people can appropriately interpret verbal cues about uncertainty and that manipulating the length of the explanation can directly impact human confidence.
Reducing the calibration and discrimination gap
Having established in experiment 2 that the uncertainty language in the LLM explanation can modify human confidence, we now evaluate whether linking the type of uncertainty language to the LLM model confidence (that is, showing a low-, medium- and high-confidence explanation when the model confidence is low, medium and high, respectively) can reduce the calibration and discrimination gap.
Selecting explanations on the basis of model confidence
We simulated the effect of aligning the explanation style to model confidence by a simple decision rule. With this rule, we select the type of explanation s ∈ {low confidence, medium confidence, high confidence} on the basis of the LLM model confidence score p
The parameters θ1 and θ2 determine the ranges where low-, medium- and high-confidence explanations are chosen. The application of this rule to a given parameter setting leads to a participant’s estimates being filtered out if the explanation style used for a specific question does not match the selected style. This allowed us to simulate the effect of participants receiving different types of explanations based on model confidence (that is, lower-confidence explanations for low model confidence and higher-confidence explanations for high model confidence). The Supplementary Information (‘optimization procedure’) provides details on the optimization procedure and also a demonstration that the results are not particularly sensitive to the parameter settings.
Calibration and discrimination results
Figure 2 shows the calibration and discrimination results when the selection rule is applied to the results from experiment 2. The results in Fig. 2 (left, red bars) show that the calibration gap has narrowed substantially. While there is still generally a higher calibration error for human confidence relative to model confidence, the calibration gap has decreased for all three LLMs relative to the baseline explanations in experiment 1. Furthermore, Fig. 2 (right) shows that the discrimination gap (as measured by AUC) has also been narrowed relative to the baseline explanations across LLMs and question types (BF >100, BF 6.48 and BF >100 for experiments 2a, 2b and 2c, respectively). Therefore, the results show that selecting the type of explanation on the basis of LLM model confidence improves both calibration and discrimination performance, as human confidence in the LLM becomes more closely aligned with the LLM’s actual accuracy.
Participants lack specialized knowledge
For the experiments with multiple-choice questions (1a, 1b, 2a and 2b), participants provided their own answer after seeing the answer from the LLM. This allowed us to analyse whether participants have any independent knowledge from the LLM that allowed them to improve on LLM accuracy. In experiments 1a and 2a with GPT-3.5, participants’ average answer accuracy was 51%, closely aligning with LLM’s 52% accuracy rate. Similarly, for the multiple-choice experiments 1b and 2b with PaLM2, average participant accuracy was 45%, similar to the 47% accuracy rate for the LLM. In the majority (82%) of responses across all multiple-choice experiments, participants selected the response that agreed with the LLM’s explanation.
When participants chose to alter the answer, the average accuracy was 33% which is lower than the LLM’s accuracy of 39% for these particular questions. These findings suggest limited success in participants’ ability to accurately answer the questions independent of the LLM’s explanation. This is consistent with findings from ref. 19, showing that Mechanical Turk workers without specialized knowledge (akin to our participant pool) scored 35% accuracy on similar questions.
When we applied the selection rule and the explanation type was aligned with model confidence, human decision accuracy in experiments 2a and 2b did not improve for the selected questions (even though discrimination and calibration improved). This shows that accurate uncertainty communication by the LLM allowed participants to recognize when the LLM was providing a probably correct or incorrect answer, but the lack of accurate human knowledge independent from the LLM prevented participants from improving on the LLM answer.
At the end of the experiment, participants estimated the performance they would achieve on similar questions for each of the ten topics in the sample of MMLU questions. The median of these self-assessed expertise estimates did not substantially vary between topics: from 30% (for example, high school physics) to 45% (for example, high school world history). Examining the impact of perceived expertise on accuracy estimation, we divided participants into two groups based on whether their self-rated expertise was above or below 50% separately for each of the ten topics. For the experiments with GPT-3.5, the higher-expertise groups generally had better discrimination (AUC 0.600 versus AUC 0.579), but there was no evidence that this difference was significant (BF <1). In addition, the calibration error was comparable between the two groups (ECE 0.289 versus 0.292). Similarly, no effect of expertise was found for the experiments with PaLM2. Therefore, participants who considered themselves more knowledgeable about a topic were not more adept at estimating the LLM’s performance in that area.
Discussion
Our research focused on bridging the gap between what an LLM knows and what users perceive it knows. This gap is critical, especially as reliance on LLMs for decision-making across various domains is rapidly increasing.
Research on LLMs has begun to address these challenges, with a focus on improving uncertainty communication and the quality of explanations. Several studies have explored LLM confidence in answering multiple-choice questions, focusing on how well the models’ self-reported confidence aligns with their actual accuracy12,13,19,24 and whether users can accurately assess the reliability of the explanations provided25. The work by ref. 26 investigates how users respond to verbal phrases of uncertainty in a simulated trivia task but does not use actual LLM outputs. Overall, there has been little research examining user confidence in LLM output. Our work uses actual LLM outputs and its confidence in an attempt to quantify the calibration and discrimination gap. As a result, we directly address the issue of miscommunication of uncertainty from LLMs to humans.
Our results showed that users consistently overestimated how accurate LLM outputs were, especially when they relied on the models’ default explanations. This was true for three different LLMs and two different types of questions (multiple choice and short answer). This tendency towards overconfidence in LLM capabilities is an important concern, particularly in scenarios where critical decisions rely on LLM-generated information. The inability of users to discern the reliability of LLM responses not only undermines the utility of these models but also poses risks in situations where user understanding of model accuracy is critical.
In addition, the results also showed a length bias where longer explanations led to higher human confidence levels even though they did not contain any additional information to help users to better discriminate between probably correct and incorrect answers. This suggests that users were processing the explanations at a shallow level, relying on simple textual cues such as overall length to predict LLM accuracy. This result is consistent with studies in social psychology and communication research that suggest that longer answers or explanations may be perceived as more persuasive or credible, even when they do not contain more meaningful information27,28. This length bias has also been found in domains such as peer reviews, where longer reviews are perceived as more persuasive and informative even if the information content remains the same29.
Although default LLM explanations do not enable users to perceive what the models truly know, this research shows that a simple approach based on tailored explanations can bridge this perception gap. This was achieved by altering the prompts used to generate explanations based on model confidence, allowing better control over how uncertainty was expressed in the responses. Specifically, we designed these prompts to induce varying degrees of certainty in the explanations, ranging from expressions of low confidence (for example, ‘I am not sure the answer is [B] because’) to high confidence (for example, ‘I am confident the answer is [B] because’). By modifying the language of the LLM’s responses to better reflect model confidence, users showed improved calibration in their assessment of the LLM’s reliability and were better able to discriminate between correct and incorrect answers. This improvement underscores the importance of transparent communication from LLMs, suggesting a need for researchers to investigate how model explanations affect user perception.
One limitation of the current study is the focus on a specific type of question involving a small number of response alternatives (multiple choice) and short answers to open-ended questions. The extent to which these results apply to longer open-ended questions remains an open question. Further research could investigate the applicability of our findings across a broader range of scenarios. Another limitation of this study is that our approach to modifying the prompt on the basis of internal uncertainty required the LLM to be prompted twice: once to read out the answer and model confidence, and again to produce an explanation modified by the model confidence. Future research could investigate how to produce confidence-modified explanations in a single step.
Another important area for future research is to understand the fundamental causes of the miscommunication of uncertainty. Why do LLMs generate calibrated model confidences while also producing explanations that are not consistent with those confidences? One hypothesis is that current LLMs are aligned to human preferences using reinforcement learning from human feedback (RLHF)30, which produces some built-in biases. In these RLHF procedures, various types of explanations are presented to human participants, who can then choose their preferred explanations. LLMs are then fine-tuned on the basis of human preference data, making them more likely to produce explanations that people prefer. While RLHF encourages human-aligned output, it inevitably reproduces any human preference biases. For example, people prefer detailed and generally longer explanations31,32. As a result, LLMs trained on these human preferences may produce explanations that are overly convincing, potentially misleading users about the reliability of the information.
An alternative hypothesis to the production of overconfident explanations lies in the autoregressive nature of well-established LLMs. In particular, we conjecture that, after committing to an answer (encoded as a sequence of tokens), the model will generate a sequence of tokens (explanation) that maximizes the likelihood of the previous answer, effectively resulting in an assertive answer. A similar hypothesis was also presented in ref. 16. Interestingly, the possibility that the LLM’s choice of a particular answer inflates the rationale for that answer resembles the phenomenon of choice-supportive biases in psychology 33. After making a decision, people tend to overestimate the desirability of the chosen option while underestimating the desirability of rejected alternatives. This can make them feel more confident in their decision than they were when they first made it.
Our work shares some parallels with prior studies on the human perception and evaluation of artificial intelligence (AI)-generated explanations in the domain of machine learning classifiers (see ref. 34 for an overview). These studies frequently use feature highlighting to explain what areas of the image35 or what fragments of documents36 can support the suggested classification. Studies have found mixed evidence for the effectiveness of these types of AI explanations in human decision-making37,38,39,40. These results highlight the challenge of ensuring that AI-generated explanations align with human expectations and allow humans to distinguish between correct and incorrect answers.
In conclusion, our research highlights the critical role of clear and accurate communication in the interaction between users and LLMs. Enhancing the alignment between model confidence and the user’s perception of model confidence can lead to more responsible and trustworthy use of LLMs, particularly in areas where the accuracy of AI-generated information is critical.
Methods
Question datasets
MMLU dataset for multiple-choice questions
The MMLU dataset is a comprehensive multitask dataset that contains multiple-choice questions from various knowledge domains, such as STEM, humanities, social sciences and more19. In total, there are 14,042 test set questions from 57 categories curated by undergraduate and graduate students from freely available online resources such as the Graduate Record Examinations and United States Medical Licensing Examination. These questions range in difficulty from high school to the professional level. The MMLU dataset is widely used to measure a text model’s multitask accuracy, as it challenges models on their real-world text understanding beyond mere linguistic comprehension, thus making it a robust benchmark for model evaluation19,41,42. For this research, we sampled a subset of 350 questions from a range of model confidence levels in ten select categories from the full dataset to comprehensively evaluate people’s assessment of LLM model confidence.
Trivia QA dataset for short-answer questions
Trivia QA is a dataset of trivia questions that can be answered in short answers22. Similar to methodology by ref. 17, contextual information was excluded to make the question answering more challenging for LLMs and more suitable for our behavioural experiments. For this research, we assessed model confidence for 5,000 questions from the original 650,000-question dataset before selecting a final sample of 336 questions from a range of model confidence levels. The final set of questions was categorized into seven different topics (culture and society, entertainment, geography, history, politics, science and technology, and sports).
Assessing model confidence and creating question subsets
Several approaches have been developed to elicit confidence in LLMs and to assess the degree to which the elicited confidence scores are calibrated (see ref. 43 for an overview). In this research, we use an approach commonly used to access internal model information based on token likelihoods, allowing the direct computation of relative probabilities of different possible answers in multiple-choice questions12,13,18,19,23. In addition, the token-likelihood approach can be extended to short-answer questions such that the token-likelihood reflects the model confidence that the LLM answer is correct13.
Methods that do not require access to internal model representations have used prompting strategies designed to elicit verbal expressions of uncertainty24,44. Confidence is expressed in natural language as numeric strings (for example, ‘80%’)24,45 or more qualitative expressions of confidence (for example, ‘I am not confident the answer is X’). Prompts can be designed to emphasize step-by-step reasoning about the correctness of individual steps and clarify the space of possible answers to lead to better calibration than simple prompts that simply ask for a confidence rating24. For short-form question answering, prompting strategies can lead to calibrated confidence levels46. However, prompting approaches have been found to be less accurate compared with methods that read out model confidence24.
Multiple-choice questions
For the multiple-choice questions, we followed the procedures based on reading out the internal token likelihoods as described in the GPT-4 Technical Report12. We used a zero-shot prompting approach, in which the model was prompted only with the target question and its associated answer options (Extended Data Fig. 1). We first assessed the LLM model confidence of GPT-3.5 and PaLM2 language models to 14,042 MMLU multiple-choice questions. This allowed us to then select questions with (somewhat) evenly distributed confidence levels. We read out the log-probabilities for the top five tokens completed by the model using the APIs for the GPT3.5 (gpt-3.5-turbo-instruct) and the PaLM2 (text-bison@002) models. The temperature parameter was set to 0. The answer was considered complete if the tokens included the single letters A, B, C and D. The log scores were then converted and normalized to probabilities across the four answer options (so that the sum of the scores equalled one). In this research, internal uncertainties, referred to in this Article as model confidence, were represented by these probabilities in all experiments, a common technique in calibration assessment with LLMs12,13,18,19,23.
Based on the model confidence levels of each LLM for all MMLU questions, we created a subset separately for each LLM. In total, 35 questions were sampled for each of 10 topics, for a total of 350 questions. For each topic, the 35 questions were sampled to approximately create a uniform distribution over model confidence using the confidence bins 0.2–0.4, 0.4–0.6, 0.6–0.8 and 0.8–1.0. However, owing to the small number of questions that lead to model confidence in the lowest confidence bin, fewer questions were sampled for the 0.2–0.4 confidence range. Supplementary Fig. 1 shows the distribution over model confidence levels for the entire MMLU dataset as well as the question subset sampled for our study. Model accuracy across the 350 questions is 55% and 50% for GPT-3.5 and PaLM2, respectively.
Short-answer questions
For the short-answer questions, we used a procedure based on the pTrue method13 to assess internal model confidence. All experiments with short-answer questions were performed with the API for the GPT-4o model (gpt-4o-mini) with the temperature parameter set to 0.7 (similar to refs. 13,17). The model was first prompted to generate the answer to each of the 5,000 trivia questions in the sample. To ensure that the model response was restricted to short answers, we used a ten-shot prompting approach where the prompt contained the target question preceded by a random sample of ten trivia question with the reference answers. The median answer length was two words.
To assess the model confidence for short-answer questions, as shown in Fig. 1 (bottom), we prompted the model with the question and the proposed answer and asked it to determine whether the proposed answer is true or false (see Extended Data Fig. 1 for an example of the exact prompt). The log scores for the true and false answer options were then converted and normalized to probabilities across the two answer options. The model confidence in our experiments corresponds to the probability for the true answer option.
For the behavioural experiments, we created a subset of 336 questions to ensure a uniform distribution across four confidence bins: 0–0.25, 0.25–0.50, 0.50–0.75 and 0.75–1.0. Supplementary Figs. 1 and 2 show the distribution of model confidence levels for the 5,000 sample and the 336 subset used in our behavioural experiments. The model accuracy across the 336 questions is 63%.
We used both automatic and human scoring methods to assess model accuracy. For the 5,000-question sample, we prompted an LLM (GPT-4o) to determine whether the reference answer from the Trivia QA had the same meaning as the LLM answer within the context of the question. For the 336-question sample, we also applied human scoring. For 97% of questions, automatic and human scoring agreed. The model accuracy for the 336-question subset was based on human evaluation.
Behavioural experiments
This section describes the methodology we used for our behavioural experiments. Experiment 1 presented default explanations from LLMs to participants, whereas experiment 2 presented explanations that were altered by different types of uncertainty language and overall length (see Table 1 for an overview of all experiments). Within each experiment, across different groups of participants, we varied the type of question as well as the type of LLM. Experiments 1a and 2a used explanations from GPT-3.5 for the MMLU multiple-choice questions. Experiments 1b and 2b used explanations from PaLM2 for the MMLU multiple questions. Finally, experiments 1c and 2c used explanations from GPT-4o for the Trivia QA short-answer questions. The Supplementary Information (‘experiment 3’) describes the results from an additional experiment 3, which was conducted to verify that our results generalize to different ways to vary the type of uncertainty language in the explanations.
Participants
A total of 301 participants completed the study across experiments 1 and 2 (Table 1 presents the breakdown by experiment). The participants were native English speakers residing in the USA, recruited through Prolific (www.prolific.com). Demographic data were obtained for 284 participants. There were 146 female and 138 male participants. The median age was 34 years (age range from 18 to 79). Supplementary Table 1 presents the breakdown of demographic information by experiment. The University of California, Irvine institutional review board approved the experimental protocol. The participants who completed experiments 1a, 1b, 2a or 2b were paid US$8 for their participation. The participants in experiments 1c and 2c required less time to complete the study and were paid US$5. The payments across experiments corresponded to a rate of approximately US$12 per hour. Before participating, all individuals provided informed consent and received detailed instructions outlining the experimental procedure as well as how to understand and interact with the user interface. Participants were also asked to sign an integrity pledge after reading all of the instructions, stating that they would complete the experiment to the best of their abilities. After submitting their integrity pledge, the participants were granted access to the experiment.
Experimental procedure
Across all experiments, participants were randomly assigned 40 questions (from the pool of 350 multiple-choice questions or the pool of 336 short-answer questions). The questions were sampled to balance across model confidence bins ensuring that all participants were exposed to questions at all levels of difficulty.
Furthermore, in experiments 2a, 2b and 2c, we balanced the types of explanation style across questions so that each question was presented approximately the same number of times with each style. It should be noted that, for each subject, each question was presented only once, and each question received only one explanation style. The counterbalancing ensured that the same question had (roughly) an equal number of observations for each explanation style (across participants).
For the multiple-choice questions, the participant’s task was divided into two phases for each question (Extended Data Fig. 2). In the first stage, the participants had to provide a probability estimate that the LLM’s answer was correct. In the second phase, the participants had to answer the question with the assistance of the LLM. The participants were instructed to use their own knowledge as well as the LLM’s response when making their own answer selection for this phase. For the short-answer questions, the participants only had to provide a probability estimate that the LLM’s answer was correct. They were instructed not to look up the answer. For the short-answer questions, the question-answering phase was omitted to prevent participants from looking up the answers.
At the end of the experiments, we administered a brief survey in which the participants self-assessed their knowledge of topics associated with the multiple-choice and short-answer questions. The participants were asked to estimate the expected accuracy for each topic if they were presented with questions similar to those they encountered during the experiment.
Creating explanation styles with varying degrees of uncertainty
This section describes how we constructed prompts to elicit explanations with varying levels of uncertainty language in the experiments. Table 2 contains examples of explanations from the two experiments and styles. For additional details on the exact prompts used, see Supplementary Table 3.
Experiment 1
To generate the baseline explanations for experiment 1, we used a simple prompt that asked for an explanation, which would also repeat the answer.
Experiment 2
In experiment 2, explanations were manipulated in terms of the level of confidence expressed in the answer as well as the length of the answer. In total, the experiment included nine types of explanations (three levels of uncertainty × three levels of length). The three levels of confidence (low, medium and high) were generated by prompts that instructed the LLM to ‘mention you are not sure/somewhat sure/sure’ in the explanations, respectively. The prompts elicited responses in which the beginning of each explanation indicated the level of uncertainty (for example, ‘I am not sure the answer is [B] because’ for the low-confidence prompt). Note that expressions of uncertainty were not limited to the start of the explanation. Answers often contained additional explanations for why the LLM lacked confidence (for example, ‘further research may be required to confirm this’ and ‘it is not possible to definitively state that…’). Experiment 2 also varied the length of the explanation across three levels: long, short and uncertainty only. The long explanations were generated by not including any instruction regarding the length of the answer. The short explanations were generated by adding an instruction to use as few words as possible in the explanation. The uncertainty-only explanations were generated by removing the rationale for the answer and including only the expression of uncertainty and the answer (for example, ‘I am not sure the answer is [B]’).
For experiment 2, the median lengths of the long and short explanations were as follows: 115 and 34 words (GPT-3.5, multiple choice), 64 and 24 words (PaLM2, multiple choice) and 95 and 24 words (GPT-4o, short answer). By comparison, the uncertainty-only responses contained a median of nine words across all variants of experiment.
Metrics
To investigate the relationship between the accuracy of answers to the multiple-choice and short-answer questions and the confidence (either human confidence or model confidence) associated with them, we utilize a range of metrics to evaluate this association. The primary focus is on understanding how well confidence levels correlate with the correctness of answers. To achieve this, we use both ECE and the AUC metric. These metrics assess the extent of overconfidence in predictions as well as the diagnostic effectiveness of confidence scores in distinguishing between correct and incorrect answers13,18,23,24,46. The use of AUC in this context parallels various metrics in psychology for metacognitive discrimination or sensitivity, which similarly aim to evaluate the effectiveness of confidence scores in distinguishing between correct and incorrect answers47. In addition, in the Supplementary Information (‘Overconfidence Error’), we also show results for the additional metric of Overconfidence Error (OE).
ECE
We evaluate miscalibration using the ECE, as detailed in refs. 48,49. The ECE is calculated by averaging the absolute differences between accuracy and confidence across M equal-width probability bins
where N represents the total sample count, Bm represents the mth confidence bin, and acc(Bm) and conf(Bm) respectively denote the accuracy and average confidence for samples in the mth bin. ECE does not account for the direction of deviations between the accuracy and the confidence per bin, respectively, so a non-zero ECE can indicate a mix of over- and underconfidence. Although recent work50,51 has shown that ECE can underestimate the true calibration error, the potential for underestimation should not be an issue given that we are interested in analysing differences in ECE rather than unbiased estimates of the error itself.
AUC
The AUC metric is used to assess the diagnostic ability of confidence scores in distinguishing between correct and incorrect answers. Utilizing the Mann–Whitney U statistic approach, the AUC represents the probability that a randomly chosen correct answer has a higher-confidence score compared with a randomly chosen incorrect answer
where Npos and Nneg denote the counts of correct (positive) and incorrect (negative) answers, respectively. Ci and Cj represent the confidence scores of the ith and jth correct and incorrect answers, respectively. I is an indicator function, which equals 1 if Ci > Cj and 0 otherwise. This method evaluates each pair of correct and incorrect answers to determine if the confidence score for the correct answer surpasses that of the incorrect one. The AUC is then the fraction of these pairs satisfying this criterion, measuring the capability of confidence scores to differentiate between correct and incorrect responses, with AUC values ranging from 0.5 (indicating no better than chance discrimination) to 1 (signifying perfect discrimination).
Statistical analysis
To assess statistical significance, we utilize BFs to determine the extent to which the observed data adjust our belief in the alternative and null hypotheses. Values of 3 < BF < 10 and BF >10 indicate moderate and strong evidence against the null hypothesis, respectively. Similarly, values of 1/10 < BF < 1/3 and BF <1/10 indicate moderate and strong evidence in favour of the null hypothesis, respectively. We report BFs for Bayesian t-tests using the default priors as recommended by ref. 52.
Reporting summary
Further information on research design is available in the Nature Portfolio Reporting Summary linked to this article.
Responses